CEO Letter

Dear Sir/Madam,
I am pleased to present the fourth report on the impact of the activities of Polskie Sieci Elektroenergetyczne on the social and economic development of the country and on the natural environment. The publication we are presenting to you summarizes the activities of our organization in 2020, a special period dominated by the COVID-19 pandemic. It is also the time of transformation that the power sector is going through.
More
Eryk Kłossowski
President of the Management Board Polskich Sieci Elektroenergetycznych S.A.
Key
figures




Impact indicators
for 2020
-
PLN 6.58 billion
of added value for the Polish economy
-
17.9 thousand
jobs retained in the domestic market due to PSE operations
-
PLN 996.13 million
the amount of taxes and contributions paid to the national budget and the budgets of local government authorities
NPS
operation
-
138,163.3 GWh
the total electricity consumption by the end users connected to the NPS
-
93,521.9 GWh
the total amount of electricity delivered from the transmission network to the domestic buyers of transmission services in 2020
Data on the power
and balancing markets
-
2,367,304 MW
the volume of capacity obligations under 55 capacity agreements concluded, covering the delivery year of 2025 under the main auction on the Polish capacity market organized in 2020.
-
100 pct.
failure-free functioning of the balancing market
-
127 participants
in the balancing market in 2020
Indicators of reliable
system operation
-
99.99 pct.
continuity of electricity supply. The indicator level for 2020 confirms power supply reliability for all our transmission service buyers
-
1.40 pct.
losses in the transmission network. The indicator was maintained at a level similar to the one achieved in 2019
-
99.73 pct.
availability of transmission equipment (DYSU). The indicator reached a high value in 2020 with a reference value of ≥ 97.5 percent
Capital expenditures
-
PLN 14.2 billion
in capital expenditures planned by PSE for 2021–2030
-
PLN 1.1 billion
in capital expenditures incurred by PSE in 2020
-
PLN 863,462 thousand
in the total value of orders awarded to contracting parties in 2020
Projections as well
as research and development
-
181.1 TWh
of projected net electricity demand in Poland in 2030
-
PLN 25.3 million
in total PSE costs incurred in 2018–2020 for research and development (PLN 6.8 million – research; PLN 18.5 million – development)
Financial data
for 2020
-
PLN 9,178 million
in net revenues from sales
-
PLN 1,170 million
in net profit
-
PLN 2,092 million
in EBITDA profit
-
pct.
(net profit / equity)
Natural environment
and climate
-
19 pct.
reduction in PSE's carbon footprint in 2020 as compared to 2017 (the first year of calculating emissions) according to the location-based method
-
26 pct.
reduction in PSE's carbon footprint in 2020 as compared to 2017 according to the market-based method
-
1,457,807 MWh
the amount of electricity losses in the electricity transmission process in 2020. At 1.4 percent, the loss ratio remained similar to the previous year
Natural environment
and climate
-
46 pct.
year-over-year decrease in the amount of SF6 gas emitted by PSE to the environment
-
98.3 pct.
decrease in the mass of soil contaminated with electrical insulating oil following leakages of the same at EHV stations, as compared to 2019


Learn about our impact
Learn about our economic impact
Learn about our economic impact

- Implementation of the business strategy for 2020-2030
- Active participation in the development of the electricity market
- Integration of the Polish market with European markets
- Our impact on Poland's economic development
- Stable operation of the national power system
- Transmission network development plan
- Strengthening innovation and implementing new technologies

Learn about our environmental impact
Learn about our environmental impact

- Carbon footprint
- PSE's priorities in the area of environmental protection
- PSE's approach to biodiversity conservation
- Energy efficiency

Learn about our impact on society
Learn about our impact on society

- Impact on local communitiese
- Quality of life of Poles vs. electricity supply
- PSE operations vs. transmission tariff and electricity bills
- Development of regions
- Flagship community projects
- Ethics management and anti-corruption
- Highest safety standards
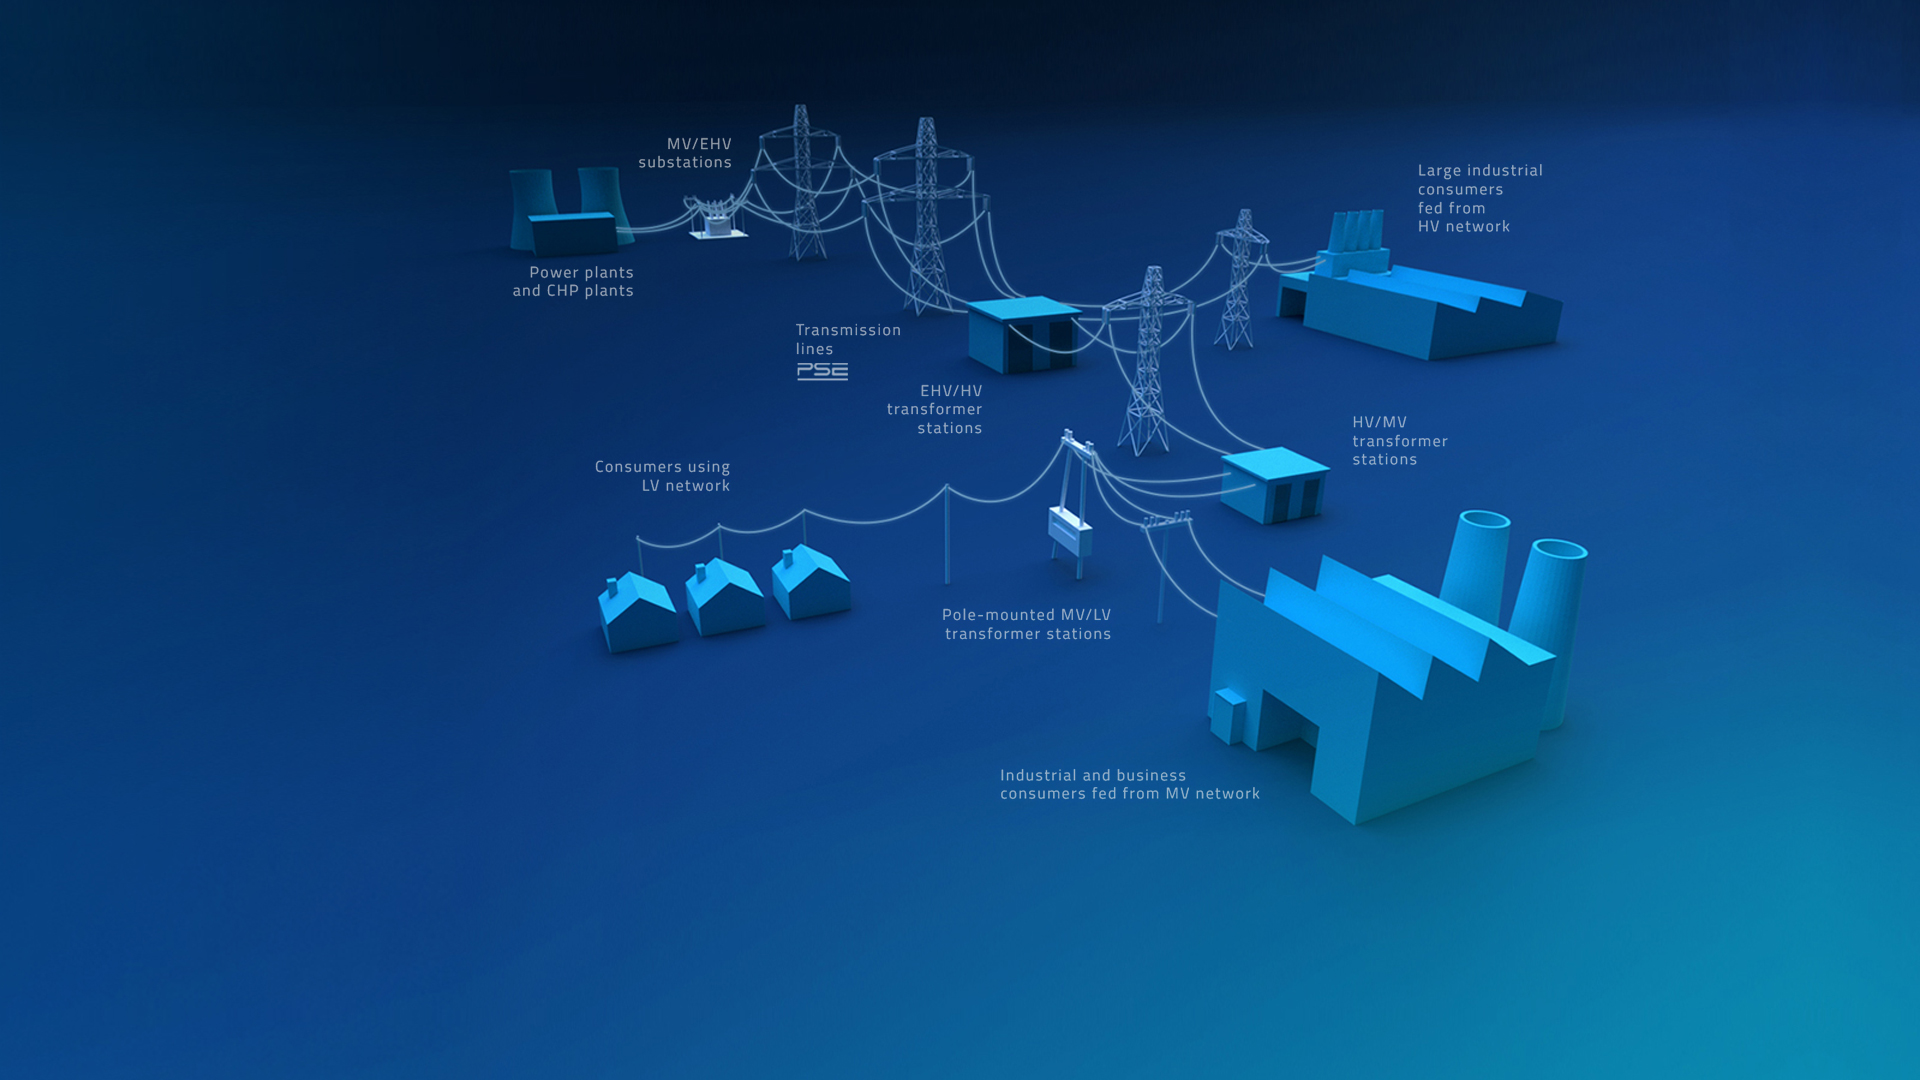
Power plants produce energy by supplying it mostly to the transmission (400 and 220 kV) or distribution networks (110 kV).
The LV (extra-high voltage) transmission lines - 220 and 400 kV - transmit energy to the LV/HV (extra-high voltage/high voltage) substation, where the voltage is transformed to 110 kV.
HV (high-voltage) lines - 110 kV - transport energy over distances not exceeding several dozen kilometers to HV/MV stations (high-voltage/medium-voltage).
Through MV lines (medium-voltage) - 6, 10, 15, 20 or 30 kV - energy is supplied to the MV/LV stations (medium-voltage/low-voltage).
Via LV lines (low-voltage) - 230/400V - energy goes to end users, e.g. households.

