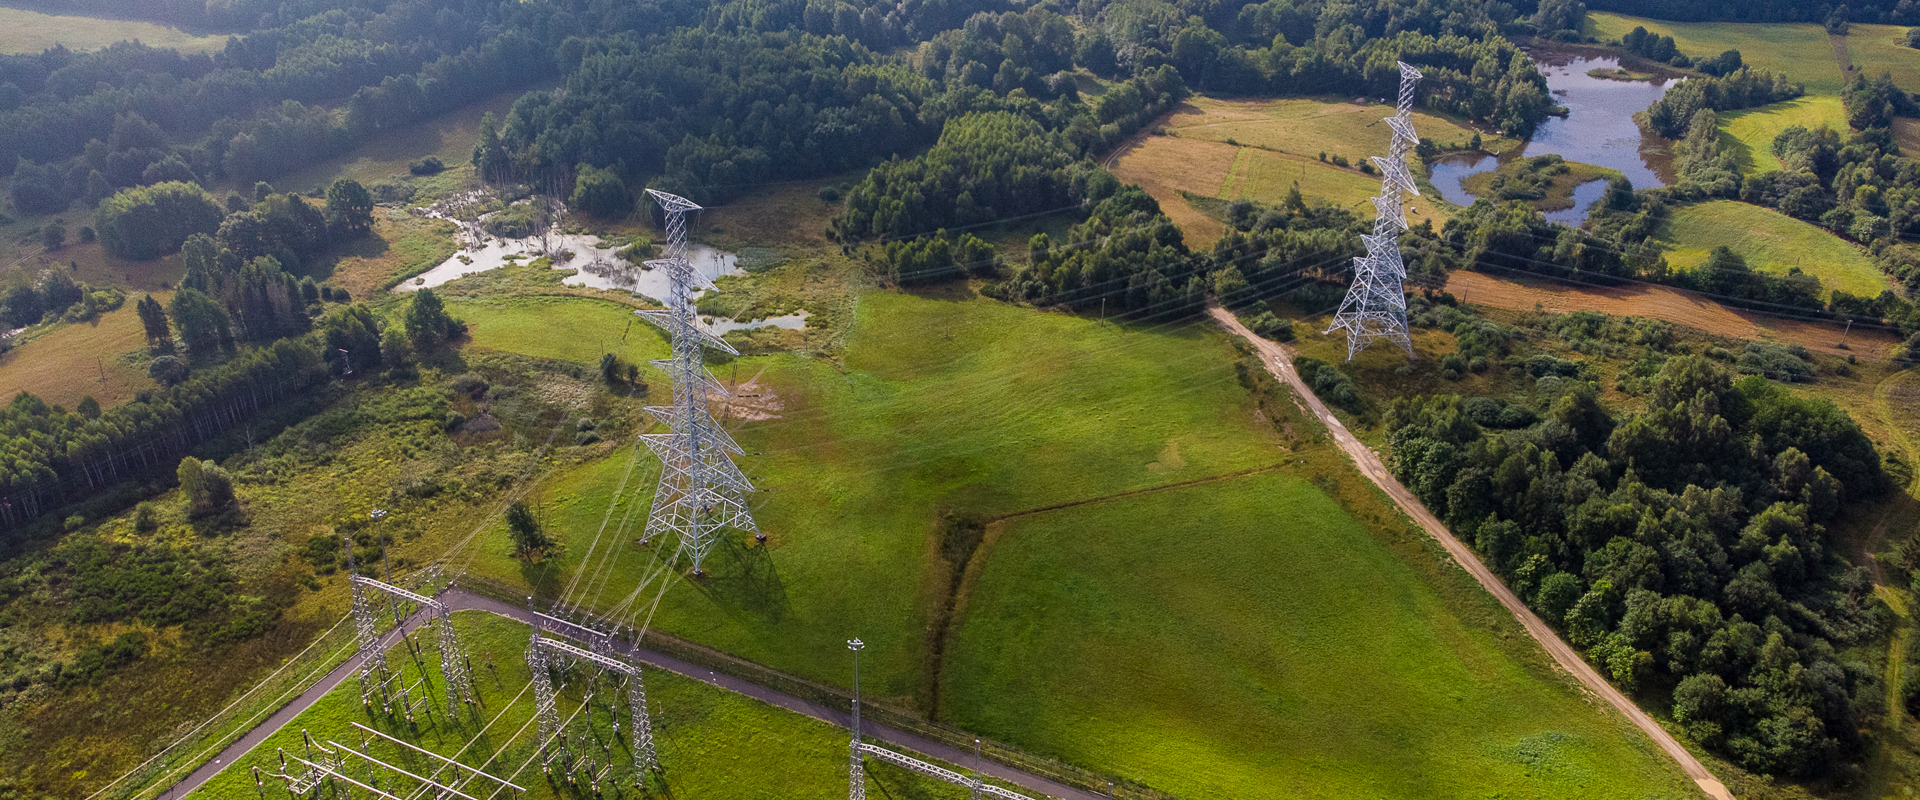
Environmental impact and climate actions
PSE makes every effort to reconcile reliable and efficient operation of the power system and its development with respect for the environment.

Each of our power investment projects meets the legal requirements for the environmental impact of extra-high voltage infrastructure.

Polish safety standards in the field of electric and magnetic fields for residential places are among the strictest in the world.

Carbon footprint

GRI 103-1 GRI 103-3
PSE is pursuing a sustainable development strategy that supports business objectives and also contributes to the achievement of the ambitious United Nations Sustainable Development Goals, including Goal 13 related to climate actions.

Through its actions, PSE affects the stable operation of the power system in Poland, thus having some impact on the volume of greenhouse gas emissions. Like other organizations, our company also affects the climate through greenhouse gas emissions resulting from the combustion of fuels and the use of electricity or heat. To measure the climate impact of PSE's operations, we continue to calculate our carbon footprint under the assumption that we have permanently included it in the impact report. The carbon footprint is becoming one of the indicators considered in evaluating the performance of our organization and is used in managing our company.

PSE's carbon footprint calculations were performed in accordance with the international GHG Protocol Corporate Accounting and Reporting Standard. We used 2017 as our baseline year - the year for which we calculated greenhouse gas emissions against which we would compare emissions in future years.
We performed the calculations for:
  • activities carried out by the entire organization, i.e. the headquarters in Konstancin-Jeziorna and branch organizational units (ZKO),
  • the tasks of the transmission system operator set forth in the regulations.

In 2020, PSE operations contributed to the following emissions:
  • by the location-based* method ─ 1,029,569 tons of carbon dioxide equivalent. In year-on-year comparisons (y/y), emissions decreased by 8 percent, and compared to 2017 - by 19 percent.
  • by the market-based* method – 1,273,759 tons of carbon dioxide equivalent. There was a 34 percent increase in emissions from 2019, and a 26 percent reduction from 2017, when emissions were first measured.
PSE's lower emissions (by location-based method) and relative to the year in which emissions were first measured are largely due to reductions in electricity losses during transmission.

Taking into account the emission indices for electricity according to the market-based method, a change of electricity provider resulting from a modification of the method of contracting energy purchases contributed to emission increase in the mentioned ranges by 34% year-on-year.

Nearly 96 percent of PSE's sources of greenhouse gas emissions are the consumption of electricity used to cover losses incurred in the energy transmission process and thus resulting from the operator's activities.

The remaining 4 percent consists mainly of electricity consumption for technical purposes by substations, electricity and heat consumption in our buildings, SF6 emissions ─ the gas used as an insulator in substation equipment, and fuel combustion in company cars.
GRI 305-1 GRI 305-2 GRI 305-3
Greenhouse gas (GHG) emissions
Mg CO2e Year-on-year change 2020 vs 2019 in % Change 2020 vs 2017 (baseline year) in %
2020 2019 2018 2017
Scope 1 - Direct GHG emissions 3 012 3 738 4 139 4 450 -19 -32
Konstancin-Jeziorna, ZKO: 3 012 3 738 4 139 4 450 -19 -32
- Gasoline 742 1 020 1 077 883 -27 +16
- Diesel fuel 844 885 869 827 -5 +2
- Natural gas 468 410 459 455 +14 +3
- SF6 812 1 142 1 579 2 082 -29 -61
- HFC's 146 281 155 202 -48 -28
Scope 2* - Indirect energy GHG emission (location-based method) 1 026 522 1 110 504 1 220 628 1 260 544 -8 -19
Konstancin-Jeziorna, ZKO: 8 201 9 393 11 204 10 802 -13 --24
- Electricity 7 146 7 885 9 627 8 957 -9 -20
- Thermal energy 1 055 1 508 1 577 1 844 -30 -43
Electricity losses in the transmission process 988 253 1 177 838 1 177 838 1 220 070 -8 -19
Substations 30 068 32 138 31 587 29 672 -6 +1
Scope 2* - Indirect energy GHG emissions (market-based method) 1 270 712 948 606 1 659 709 1 714 399 +34 -26
Konstancin-Jeziorna, ZKO: 5 492 5 736 9 861 9 553 -4 -43
- Electricity 4 437 4 228 8 284 7 708 +5 -42
- Thermal energy 1 055 1 508 1 577 1 844 -30 -43
Electricity losses in the transmission process 1 246 227 915 351 1 606 758 1 664 369 +36 -25
Substations 18 993 27 519 43 089 40 477 -31 -53
Scope 3 - Other indirect GHG emissions 34 319 283 194 -89 -82
Konstancin-Jeziorna, ZKO: 34 319 283 194 -89 -82
- Business trips of company employees - by airplane 34 319 283 194 -89 -82
Scope 1 + 2 (location-based) + 3 1 029 569 1 114 561 1 225 050 1 265 188 -8 -19
Scope 1 + 2 (market-based) + 3 1 273 759 952 663 1 664 130 1 719 043 +34 -26
* For Scope 2 emissions calculated using the location-based method, the average index for Poland was used as the GHG emission index associated with the generation of a unit of electricity, and for emissions calculated using the market-based method, emission indices specific to our electricity sellers were used.

Data sources and emission indices

Data on energy and fuel consumption are based on invoices and internal records. Emissions of SF6 and HFC gases (hydrofluorocarbon greenhouse gases) were determined based on gas refilling levels. The distance traveled by airplane was determined based on internal records and flight routes.

For fuels, electricity (location-based method) and heat (until 2019) emission indices and calorific values based on data from the National Center of Emission Balancing and Management were adopted in the calculations, for heat in 2020 the index published by the Energy Regulatory Office was adopted, for SF6 and HFC gases GWP100 indices were adopted according to 4. Report of the Intergovernmental Panel on Climate Change, abbreviated asIPCC. Emission indices for electricity according to the market-based method were adopted based on the information on the structure of fuels used as published on websites of relevant energy providers. Emission indices for air travels were taken from the DEFRA database (Department for Environment, Food and Rural Affairs in the UK Government).

No biogenic greenhouse gas emissions were identified. The greenhouse gas included in the emission indices for fuel, electricity and heat is CO2.
GRI 305-4
GHG emission intensity index per unit of electricity returned from the grid
Mg CO2e
2020 2019 2018 2017
GHG emissions scope 1 + 2 (location-based) + 3 [Mg of CO2e] 1 029 569 1 114 561 1 225 050 1 265 188
Amount of energy delivered from the grid - [MWh] 102 639 157 105 739 380 107 089 437 102 646 083
GHG emissions/MWh of energy delivered from the grid [Mg of CO2e/MWh] 0,0100 0,0105 0,0114 0,0123
The carbon footprint is the sum of greenhouse gas emissions caused directly or indirectly by a person, organization, event or product. It includes emissions of carbon dioxide, methane, nitrous oxide and other greenhouse gases expressed in CO2 equivalent. An organization's carbon footprint includes the emissions caused by all of its operations. Its measure is MgCO2e – a ton (megagram) of carbon dioxide equivalent.
Carbon footprint is one of the key tools of modern environmental management. It is international in nature and is increasingly being used by entrepreneurs as one of the primary methods to improve the efficiency of business operations.

Strona wykorzystuje pliki cookies. Używamy informacji zapisanych za pomocą cookies w celach statystycznych oraz w celu dostosowania serwisu do indywidualnych potrzeb użytkowników. W przeglądarce internetowej można zmienić ustawienia dotyczące cookies. Więcej o plikach cookies i o ochronie Twojej prywatności read here